How many prompts before the number means anything
Every measurement post asserts a prompt count. None of them show the arithmetic. Here is the arithmetic, run three times, for three different claims.

- There is no universal prompt count. The required N is a function of the claim, and the three common claims need N values that differ by more than an order of magnitude.
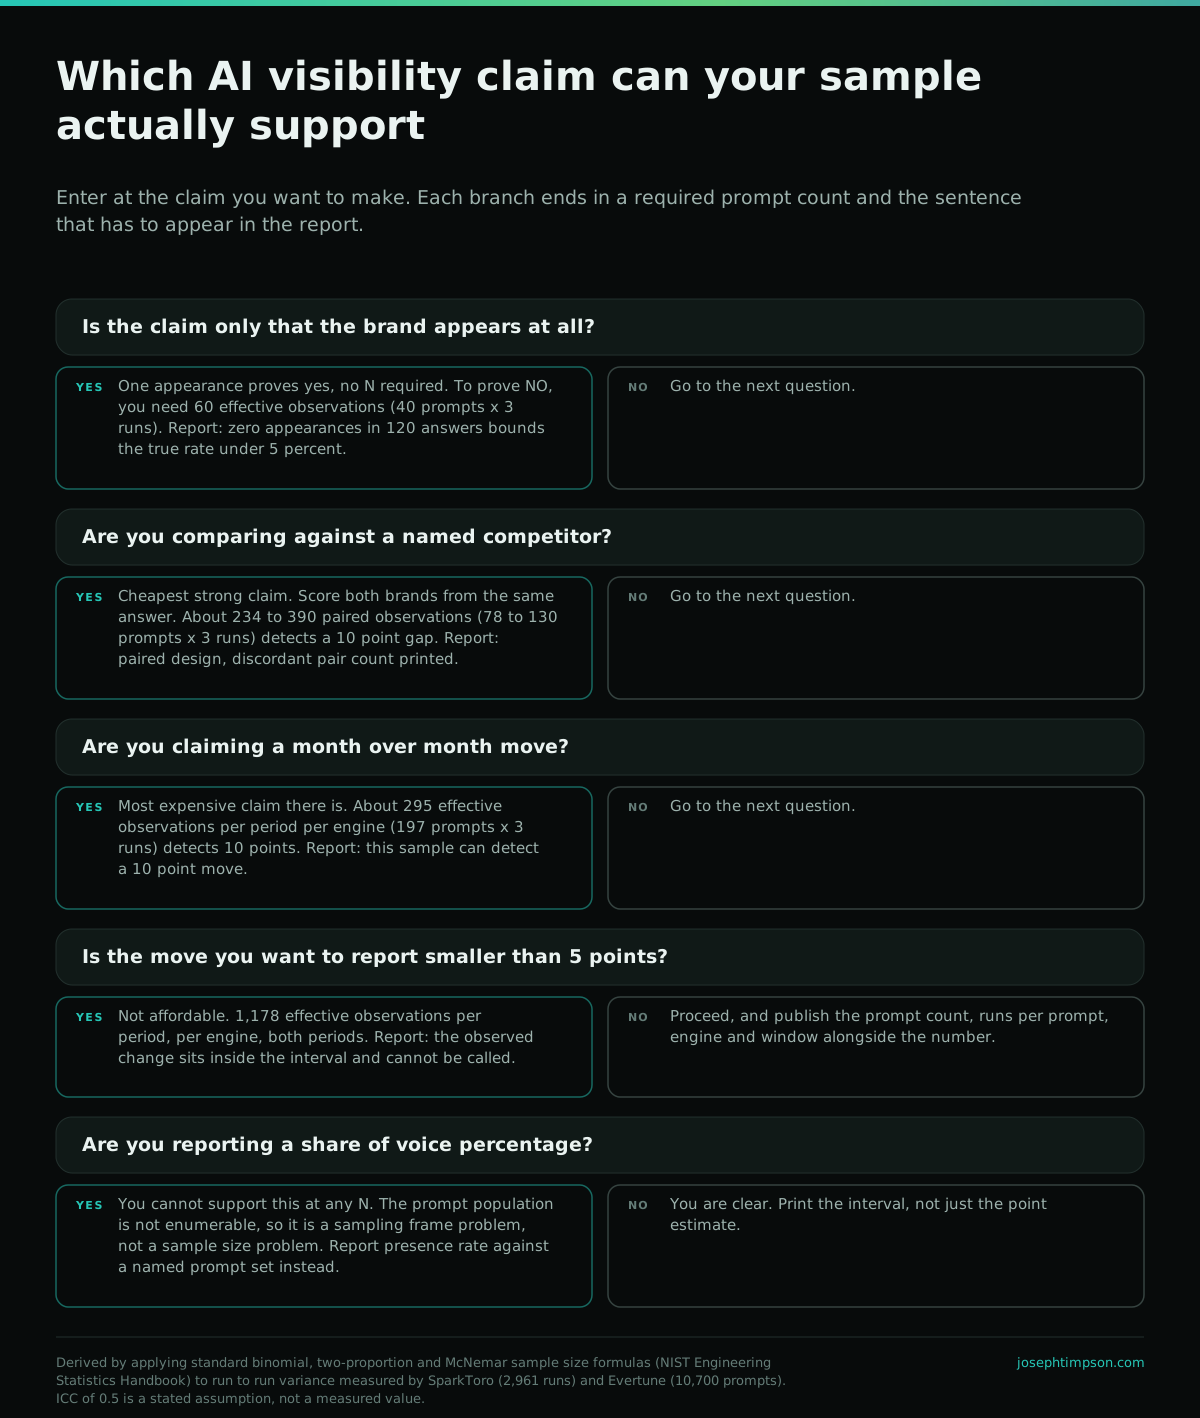
- Proving a brand is effectively absent takes roughly 60 effective observations. Detecting a 10 point month over month move takes roughly 295 per period. Detecting a 5 point move takes roughly 1,178.
- Repeating one prompt has a hard ceiling. No matter how many runs you buy, one prompt is worth at most 1 divided by the intraclass correlation in independent observations, which is usually under three.
- Competitive claims are the cheapest strong claims available, because scoring your brand and a competitor from the same answer cancels the prompt effect. About 234 paired observations detects a 10 point gap versus about 708 unpaired.
- A share of voice percentage cannot be supported at any N. The prompt population is not enumerable, so the problem is a sampling frame problem and sample size does not touch it.
The number in your last report had an error bar you did not print
There is no universal prompt count. The required N is a function of the claim being made. Proving a brand is effectively absent takes roughly 60 effective observations. Detecting a 10 point month over month move takes roughly 295 per period per engine. Detecting a 5 point move takes roughly 1,178. A share of voice percentage cannot be supported at any N, because the prompt population is undefined. Derive the N from the claim, then publish both numbers side by side.
Evertune ran 10,700 prompts on ChatGPT and published the one thing almost nobody in this field publishes: the error bar. Ask the same SUV question five times and Acura appears in about 10 percent of answers. The margin of error on that 10 percent is 27 points. The honest reading of a five run test is "somewhere between zero and 37 percent."
Most agency AI visibility reports are built on fewer runs than that.
I have written those reports. I have shown a client a number that moved from 18 percent to 24 percent on a twelve prompt set and let the room read six points as progress. It was not progress. It was the same number twice, sampled badly.
This post derives the N instead of asserting it. Every formula is textbook, every input is either measured by someone who published their method or flagged as an assumption you should replace with your own data. Where I am guessing, I say so.
The two most careful voices on this question contradict each other
Search the question and you get counts, not derivations. Fifteen to twenty prompts per topic. Thirty per product. Fifty to a hundred and fifty for B2B software. Forty to a hundred prompts at three hundred to nine hundred runs. Every one of those is a number handed down without a formula attached.
The two most rigorous public answers land on opposite sides of the central trade.
Rand Fishkin, after 2,961 prompt runs collected from 600 volunteers across ChatGPT, Claude and Google AI, concluded you need to ask repeatedly, at least 60 to 100 times, and average. Evertune arrived at the same place from a completely different dataset: 100 repetitions, then diminishing returns. Both are arguing for depth on each prompt.
Nick Lafferty's AI visibility metrics reference states the inverse: a fifty prompt set run ten times tells you more about stability than a five hundred prompt set run once. Same field, same year, opposite instruction.
One page in the top results for this query does show a derivation, using the Wilson score interval and the survey design effect. Its inputs come from a variance components study that is not published anywhere, not downloadable, and carries no byline beyond the site founder's. I looked for the underlying data and there is none to audit. A derivation you cannot check is a number with extra steps.
That disagreement is resolvable. The answer is not a matter of taste, and it does not come out evenly split.
Three sources of variance, and repetition only touches one
An AI visibility number wobbles for three separate reasons. They are not interchangeable, and the fix for one does nothing for the other two.
Sampler nondeterminism. The same prompt to the same model produces different text on different calls. This is not just temperature. Horace He and colleagues at Thinking Machines Lab ran 1,000 completions of a single prompt at temperature zero, where sampling is theoretically deterministic, and got 80 distinct outputs. The cause is that inference kernels are not batch invariant, so what other users are doing on the same server changes your result.
Surprisingly, we generate 80 unique completions, with the most common of these occuring 78 times.
Between prompt variance. Two prompts a human would call identical in intent return wildly different brand sets. SparkToro collected 142 human written prompts asking for the same kind of recommendation and measured an average pairwise semantic similarity of 0.081. The academic version is worse. Melanie Sclar and co-authors, in the ICLR 2024 paper on prompt format sensitivity, found accuracy swings of up to 76 points from meaning preserving formatting changes alone.
Our analysis suggests that work evaluating LLMs with prompting-based methods would benefit from reporting a range of performance across plausible prompt formats, instead of the currently-standard practice of reporting performance on a single format.
Corpus drift. Retrieval augmented answers read a live index. The index changes daily, the model gets updated without notice, and the retrieval policy changes with it.
Here is the part that decides everything downstream. Running a prompt more times shrinks the first source and only the first source. It does nothing to the second, because you are still sampling the same prompt. It does nothing to the third, because time keeps moving. If you want your category number to get more precise, you have to buy prompts, not runs. That is not an opinion, and the next two sections show why.
The arithmetic nobody prints
An appearance rate is a binomial proportion. The 95 percent margin of error on an observed rate p over n independent observations is 1.96 times the square root of p times 1 minus p divided by n. That formula, and the sample size formulas that follow from it, are in the NIST Engineering Statistics Handbook, which is free and has been there for twenty years.
At an observed rate of 20 percent, which is a realistic AI visibility number for a brand with some traction:
| Independent observations | 95% margin of error | What you can honestly say |
|---|---|---|
| 10 | 24.8 points | Nothing |
| 25 | 15.7 points | Nothing quantitative |
| 50 | 11.1 points | Present, roughly, in a wide band |
| 100 | 7.8 points | A rate, with the band printed |
| 200 | 5.5 points | A rate, and a large move |
| 400 | 3.9 points | A rate, and a moderate move |
| 1,000 | 2.5 points | A rate, and a small move |
Run Evertune's own published numbers through this and two of the three reconcile exactly. At an observed 10 percent, the formula gives 26.3 points at five runs against their reported 27, and 5.9 points at 100 runs against their reported 6. Their 12 run figure of 12 points does not reconcile at that same rate, where the formula gives 17.0. That is not an accusation. It probably means the 12 run point on their chart sits at a different observed rate, or uses a different interval method. But because the formula was not printed alongside the chart, nobody outside the company can tell. That is the whole problem with this genre in one example.
Consistently, we see tight margins of error at 100 repetitions and diminishing returns for repetitions beyond this point.
One more warning before we use any of this. The normal approximation above is unreliable at the extremes, and AI visibility rates live at the extremes. Brown, Cai and DasGupta, writing in Statistical Science, showed that the standard Wald interval has erratic coverage that persists even at large n. When your observed rate is under 10 percent or over 90 percent, use a Wilson score interval instead. The N you need does not change much. The interval you print does.
Why runs per prompt hit a ceiling you cannot buy past
The formulas above assume independent observations. Ten runs of the same prompt are not ten independent observations. They are ten correlated draws from one prompt's own appearance rate.
Survey statistics has handled this for decades with the design effect. With m runs per prompt and an intraclass correlation of ICC, the effective sample size is the raw count divided by 1 plus m minus 1 times ICC. Rearranged, the effective observations you get from a single prompt run m times is m divided by 1 plus m minus 1 times ICC.
Take the limit as m goes to infinity and the whole expression collapses to 1 divided by ICC. That is the ceiling. It does not matter how many runs you buy.
| Runs per prompt | ICC 0.2 | ICC 0.4 | ICC 0.6 | ICC 0.8 |
|---|---|---|---|---|
| 3 | 2.14 | 1.67 | 1.36 | 1.15 |
| 5 | 2.78 | 1.92 | 1.47 | 1.19 |
| 10 | 3.57 | 2.17 | 1.56 | 1.22 |
| 50 | 4.63 | 2.43 | 1.64 | 1.24 |
| Infinite | 5.00 | 2.50 | 1.67 | 1.25 |
Read the ICC 0.6 column. Going from 3 runs to 50 runs is a sixteen fold increase in cost and it buys you 21 percent more information. Going from 1 prompt to 16 prompts at 3 runs each, for the same money, buys you sixteen times more.
This is the arithmetic that settles the Fishkin versus Lafferty disagreement, and it settles it in a way that makes both of them right about different questions. If you want to know how visible you are for one specific prompt, run that prompt 60 to 100 times. Fishkin and Evertune are correct and their advice is precise. If you want a category level number, the unit of analysis is the prompt, not the run, and your precision is capped by prompt count no matter what you do. Lafferty's framing, that runs beat prompts, is the one the design effect contradicts.
Claim one: does the brand appear at all
This claim is asymmetric, and almost nobody treats it that way.
Proving yes is free. One appearance in one run proves the brand can appear. There is no N to derive. Stop measuring and go do something useful.
Proving no is expensive, and it is the claim that actually sells work. When you tell a prospect they are invisible in ChatGPT for their category, you are asserting a rate near zero from a sample of zero hits. The correct tool is the statistical rule of three: if an event did not occur in n observations, the 95 percent upper bound on its true rate) is 3 divided by n.
| Observations with zero appearances | True appearance rate could still be as high as |
|---|---|
| 20 | 15.0% |
| 30 | 10.0% |
| 60 | 5.0% |
| 100 | 3.0% |
| 300 | 1.0% |
So the standard sales-deck audit, twelve prompts run once, supports exactly this sentence: the brand's true appearance rate is under 25 percent. That is a sentence nobody would pay for. To say "under 5 percent," which is what people actually mean by invisible, you need 60 effective observations. At three runs per prompt and an assumed ICC of 0.5, that is 40 prompts and 120 answers. Affordable. Just not twelve.
Claim two: did it move month over month
This is the most expensive claim in the entire discipline and it is the one every retainer promises monthly.
A month over month comparison sets two noisy estimates against each other. The variances add. The standard error of the difference is the square root of the sum of each period's variance term, and to call a change real at 95 percent confidence with 80 percent power, the observed move has to clear 2.80 standard errors. The two proportion sample size formulas behind that threshold are standard and public.
At a visibility rate around 25 percent in both periods, here is what that costs per engine, per period.
| Move you want to report | Effective observations per period | Prompts at 3 runs, ICC 0.5 | Answers per engine per period |
|---|---|---|---|
| 20 points | 74 | 50 | 150 |
| 10 points | 295 | 197 | 591 |
| 5 points | 1,178 | 786 | 2,358 |
| 3 points | 3,270 | 2,180 | 6,540 |
Now multiply. A 10 point move, confirmed across four engines, across two periods, is 197 prompts times 3 runs times 4 engines times 2 periods. That is 4,728 answers. Semrush's prompt tracking caps most plans at 25 to 200 tracked prompts. The 5 point row is not affordable for a small business retainer at any vendor's pricing, and pretending otherwise is where this industry loses its credibility.
The operational consequence is blunt. If a month over month move in your report is smaller than 10 points, you do not have the sample to call it. Report the interval and say the change sits inside it. That is a defensible sentence and clients respect it more than a fake arrow. The same discipline belongs in your GEO client reporting template, and it is why my measurement stage starts by fixing the claim before it sizes the sample.
MEASURE is stage two of the Cited Method, and this derivation is the instrument it runs on. Access first, measurement second, and no number leaves the building without its N attached.
See how MEASURE works→Claim three: do we beat a named competitor
Here is the finding I did not expect when I started running these numbers, and it changes what I sell.
Comparative claims are the cheapest strong claims available, by roughly a factor of three, and the saving is free.
The trick is pairing. Score your brand and the competitor from the same answer, on the same prompt, in the same run. Now the prompt level effect, which is the dominant variance component and the thing driving the whole design effect problem, is identical for both brands and cancels out of the difference. You are no longer estimating two noisy rates and subtracting. You are directly observing which brand won each answer.
Run McNemar's test on the discordant pairs. At a 30 percent versus 40 percent appearance split and a moderate discordance rate, detecting that 10 point gap takes roughly 234 paired observations. If discordance runs higher, call it 390. The unpaired equivalent, two independent samples compared, needs about 354 per brand, so 708 total.
| Design | Observations to detect a 10 point gap | Prompts at 3 runs |
|---|---|---|
| Paired, both brands scored from one answer | 234 to 390 | 78 to 130 |
| Unpaired, brands measured separately | 708 | 236 |
And because the prompt effect cancels, the design effect largely goes away for the comparison, so you do not have to inflate that number the way you do for the absolute rate.
Seventy eight prompts run three times is an afternoon of API spend. That is a real, defensible, statistically supported competitive claim, available to any agency, and I have not seen a single vendor dashboard structured to produce it. They all report your rate and their rate as separate lines. Pairing is sitting there unclaimed. If you are building or buying in this space, that is the question to ask your AI visibility tracking tools vendor first.
The claim you cannot buy at any N
Share of voice. A percentage. To one decimal place.
The reason this fails is not sample size, and that is why no amount of budget rescues it. A percentage is an estimate of a population parameter, and it requires a defined population. For AI visibility, the population is "all the prompts a real buyer might type." That set is not enumerable, not stable, and not observable. SparkToro's 0.081 average semantic similarity across 142 human written prompts for one intent is the empirical proof: the humans could not even agree on what the question was.
So your denominator is a prompt set somebody at your agency wrote. Change the set, change the number. That is a sampling frame problem, and sample size does not touch sampling frame problems.
But, any tool that gives a "ranking position in AI" is full of baloney.
And there is no first party fallback. Google shipped generative AI performance reports in Search Console in June 2026, which is genuine progress, but they show impressions on your own pages. Search Engine Land reported that AI Mode data cannot be filtered out from the rest of Search. Nothing in that product tells you what share of a category's answers named you rather than a competitor. No engine ships that. Every share of voice figure in every dashboard you have ever seen is a vendor's sample estimate of an undefined population, presented without an interval.
That does not make the work worthless. It makes the claim worthless. Measure presence, measure relative position against named competitors, and refuse the percentage.
The protocol, and the sentences that go in the report
Everything above collapses into a short operating procedure. This is what I run.
Fix the claim first
Write the sentence you intend to put in the report before you write a single prompt. The claim determines the N. Doing this in the other order is how twelve prompt reports happen.
Freeze and version the prompt set
The set is your denominator. Changing it mid engagement invalidates every comparison. Version it, date it, and hand the client a copy. Building it well is its own discipline, covered in the prompt set piece.
Buy prompts, not runs
Three runs per prompt. Past that, the design effect eats your money. Spend the difference on breadth.
Score competitors from the same answer
Every run gets scored for your brand and three named competitors simultaneously. This is what makes the comparative claim affordable, and it costs nothing extra.
Collect in a tight window
Corpus drift is not reducible by sampling. Compress the collection window so it cannot masquerade as a trend.
Measure your own ICC quarterly
Twenty prompts, ten runs each, one sitting. Recompute the design effect. Your ICC is not mine and it moves when engines change.
And then the language. A number without these sentences attached is not a measurement, it is a decoration.
- The prompt set size, the runs per prompt, the engine, and the collection window.
- The interval, not just the point estimate. Wilson, not Wald, when the rate is under 10 percent or over 90 percent.
- For an absence claim: the rule of three upper bound. "Zero appearances in 120 answers bounds the true rate under 5 percent at 95 percent confidence."
- For a movement claim: the smallest move this sample could have detected. "This sample can detect a 10 point move. The observed change was 4 points and sits inside the interval."
- For a competitive claim: that it is paired, and the discordant pair count.
- For share of voice: do not report it. Report presence rate against a named prompt set and relative position against named competitors.
The reason this matters beyond statistical hygiene is that the whole Cited Method runs downstream of it. If MEASURE produces a number nobody can defend, then MAP, EARN and PROVE are all decorating noise. Fix the instrument first, then use it. Access comes before all of it, which is why the crawler access audit is stage one and this is stage two.
Kevin Indig, writing up the ghost citations study Semrush ran with Growth Memo, puts the mapping problem this way.
Brands need to map not just which topics they want to appear in, but which phrasing patterns produce mentions versus ghost citations.
That is the right instinct and it has a sample size attached to it, which is the part usually left off. Mapping phrasing patterns means treating the prompt as the unit, which means prompt count is your budget line. The rest of this cluster works out what to do with the map: how to read the citation sources you find, how to tell a citation from a recommendation, what a full audit looks like end to end, and which myths to stop paying for. More of it is filed in insights.
If you want the derivation applied to your category rather than a generic one, book a call and bring your prompt set.
Frequently asked questions
How many prompts do I need to track AI visibility?
It depends entirely on the claim. Proving a brand is effectively absent takes about 40 prompts at three runs each. Detecting a 10 point month over month move takes about 197 prompts per engine per period. Beating a named competitor by 10 points takes about 78 prompts if you pair the scoring.
Is it better to run more prompts or repeat each prompt more times?
More prompts, for any category level claim. The design effect caps what repetition can buy at 1 divided by the intraclass correlation, usually under three effective observations per prompt no matter how many runs. Repetition only wins when you want a precise rate for one specific prompt.
Why do I get a different AI visibility number every time I run the same test?
Three separate causes. Sampler nondeterminism, which persists even at temperature zero because inference kernels are not batch invariant. Between prompt variance, which is large. And corpus drift, because retrieval reads a live index that changes daily. Only the first shrinks with repetition.
How many runs per prompt should I use?
Three, for category level measurement. Past three runs the design effect makes each additional run buy progressively less information while costing the same. Spend the saved budget on additional prompts instead, which raises precision without hitting a ceiling.
Can I report AI share of voice as a percentage?
Not defensibly. A percentage estimates a population parameter and requires a defined population. The set of prompts a real buyer might type is not enumerable or stable, so the denominator is whatever set you wrote. That is a sampling frame problem and no sample size fixes it.
What can I say if my brand never appeared in the test?
Use the rule of three. Zero appearances in n observations bounds the true rate at 3 divided by n with 95 percent confidence. Twelve runs only supports under 25 percent. To claim under 5 percent, which is what invisible usually means, you need 60 effective observations.
Does Google Search Console show AI visibility now?
Partly. Google shipped generative AI performance reports in June 2026, showing impressions on your own pages inside AI experiences. Search Engine Land reported AI Mode data cannot be filtered out separately. Nothing in the product reports competitor share, so first party share of voice still does not exist.
What is the intraclass correlation and why do I need it?
It is the share of total variance sitting between prompts rather than within them, and it sets the design effect that converts raw answers into effective observations. No verified public value exists for AI visibility, so measure your own: twenty prompts, ten runs each, one sitting.
Why are competitive claims cheaper than movement claims?
Because pairing cancels the prompt effect. Scoring your brand and a competitor from the same answer removes the dominant variance component from the difference. That takes roughly 234 paired observations to detect a 10 point gap versus about 708 for the unpaired equivalent.
Should I use a Wilson interval or the standard formula?
Wilson, whenever the observed rate is under 10 percent or over 90 percent, which describes most AI visibility readings. Brown, Cai and DasGupta showed the standard Wald interval has erratic coverage that persists at large sample sizes. The required N barely changes. The printed interval does.
Sources
- SparkToro. New Research: AIs Are Highly Inconsistent When Recommending Brands or Products (2026-01)
- Evertune. How many repetitions of a single prompt does it take to understand your AI visibility? (2026-07)
- Thinking Machines Lab. Defeating Nondeterminism in LLM Inference (2025-09)
- ICLR 2024 (Sclar, Choi, Tsvetkov, Suhr). Quantifying Language Models' Sensitivity to Spurious Features in Prompt Design (2024-01)
- NIST/SEMATECH e-Handbook of Statistical Methods. Sample Sizes Required (proportions) (2012-04)
- John D. Cook. The statistical rule of three (2010-03)
- Wikipedia. Rule of three (statistics) (2026-07)
- Statistical Science (Brown, Cai, DasGupta). Interval Estimation for a Binomial Proportion (2001-05)
- Semrush with Growth Memo. The Ghost Citations Study (2026-06)
- Semrush Knowledge Base. Prompt Tracking on Semrush (2026-07)
- Google Search Central. Introducing Search Generative AI performance reports in Search Console (2026-06)
- Search Engine Land (Danny Goodwin). Google AI Mode traffic data comes to Search Console (2025-06)
- Nick Lafferty. AI Visibility Metrics: Formulas, Benchmarks and Sample Sizes (2026-07)
- Ahrefs (Louise Linehan, Xibeijia Guan). Does adding schema markup increase AI citations? (2026-05)
Joseph Timpson has worked in search since 2010 and runs Timpson Marketing out of St. George, Utah. He built The Cited Method, a five stage framework for earning and proving real citations in AI answers, and publishes what does not work alongside what does.
Want me to run this on your site and show you the before and after?
One call, no pitch deck. We look at what is actually blocking you and tell you the truth about whether we can help.
Book a free consultation →