The AI Overviews click studies do not agree
Ten published measurements, an 84 point spread, and not one of them is wrong. The disagreement dissolves the moment you sort them by what they actually measured.

- Seer Interactive measured a 65.2% organic CTR decline when an AI Overview appears and you are not cited. Amsive measured an 18.68% CTR increase on branded keywords that trigger AI Overviews. Both used real Google Search Console data and both are correct.
- The studies disagree because they measure four different quantities: position-one CTR, agency portfolio CTR, per-visit click rate, and zero-click share. Those are four different questions, not four answers to one question.
- The most under-reported number in the field is Seer's control group. On the same query set with no AI Overview present at all, CTR still fell 46.2% year over year. Most of the decline is not attributable to AI Overviews.
- CTR fell partly because impressions grew. Seer recorded a month where clicks moved from 398K to 400K while impressions went from 15.8M to 33.1M. A falling ratio with a flat numerator is not lost traffic.
- Google disputes the studies but publishes no sample, window, or method. Its own Search Console generative AI report shows impressions only, with no clicks and no CTR.
Ten measurements, one question, an 84 point spread
The published AI Overview click studies disagree because they measure different quantities, on different query populations, over different windows. Ahrefs measured position-one CTR across two keyword cohorts. Seer measured portfolio CTR for named brands. Pew measured the click rate per browsing session. Amsive measured the same already-ranking keywords before and after an AI Overview appeared. Those are four different questions. The headline numbers were never comparable, and nobody said so.
Seer Interactive reports a 65.2% organic CTR decline when an AI Overview is present and your page is not cited. Amsive reports an 18.68% CTR increase on branded keywords that trigger AI Overviews.
Both were measured on real Google Search Console data. Both are correct. That is an 84 point spread on what looks like a single question, and it is why a client sent you two links this week and asked which one to believe.
The correct answer is that the question was underspecified. I have read every write up I can find on this topic, and they all do the same thing: they cover one study, quote its headline, and treat the others as noise. The one aggregation I found that lists twelve of them, IDEAVA's roundup, says the magnitude varies "depending on methodology, query type, and measurement window" and then never connects a single methodological choice to a single number.
That connection is the whole job. Here it is.
The reconciliation table
Every row below comes from a page I fetched. The last column is the part that matters, because it is the one nobody publishes.
| Study and date | What it actually measured | Query population and window | Design | Headline number | What it cannot be used to claim |
|---|---|---|---|---|---|
| Ahrefs, Feb 2026 | Desktop CTR of the top-ranking organic page | 150,000 AI Overview keywords vs 150,000 informational keywords without one, Dec 2023 vs Dec 2025 | Two separate cohorts, forecast vs actual | -58% | Not a same-page before and after. The cohorts are matched on intent and nothing else. |
| Ahrefs, Apr 2025 | Same | Same 300,000 keyword design, Mar 2024 vs Mar 2025 | Two separate cohorts | -34.5% | Same limits. The gap to 58% is a later window, not a better method. |
| Seer Interactive, Nov 2025 | Organic CTR across 42 client organizations | 3,119 informational and educational queries, 25.1M organic impressions, Jun 2024 to Sep 2025 | Within-portfolio, split by AI Overview presence and citation status | -65.2% not cited, -49.4% cited, -46.2% with no AI Overview at all | Not a general web figure. Agency portfolios skew commercial and heavily optimized. |
| Seer Interactive, Apr 2026 | Same measurement, extended | 53 brands, 5,471,127 queries, 2.43B organic impressions, Jan 2025 to Feb 2026 | Same design | CTR floor of 1.3% in Dec 2025 rising to 2.4% by Feb 2026 | Not proof that AI Overviews became friendlier. Impression volume moved at the same time. |
| Pew Research Center, Jul 2025 | Share of search visits containing any result click | 68,879 Google searches by 900 US adults, Mar 2025, tracked browsers | Observed browsing panel, AI summary present vs absent | 8% vs 15% | Not a page-level CTR. It is a per-visit click rate, and Google chose which queries got a summary. |
| Amsive, Apr 2025 | CTR of keywords the site already ranked for | 700,000 keywords across 10 sites in 5 industries; 10,000 AI Overview keywords with existing rankings | Same keywords, before vs after an AI Overview appeared | -15.49% overall, -19.98% non-branded, +18.68% branded | Not a whole-SERP figure. It covers only keywords where the site already had a position. |
| Authoritas via Press Gazette, Jul 2025 | Publisher clickthrough loss | 3,500 UK news search terms, 16 to 22 April 2025 | News keyword set, desktop and mobile measured separately | -47.5% desktop, -37.7% mobile | Not generalizable past news. One week, one country, one vertical, one intent type. |
| Semrush, Dec 2025 | Zero-click rate | Keywords with no AI Overview in May 2025 that had one by Oct 2025, drawn from a 200,000+ keyword set, Datos clickstream | Same keywords, before vs after | Zero-click fell from 33.75% to 31.53% | Not evidence that AI Overviews generate clicks. The selection effect is unresolved by the authors' own admission. |
| SparkToro, Jun 2026 | Zero-click share of all US Google searches | US browser searches Jan to Apr 2026, Similarweb panel, excludes the Google mobile app | Cross-sectional trend | 68.01%, up from 60.45% in 2024 | Not an AI Overview measurement at all. It is total SERP behavior across every feature. |
| Google (Liz Reid), Aug 2025 | Total organic click volume | Not stated | Not stated | "relatively stable year-over-year" | Nothing, publicly. No sample, no window, no method, no data release. |
Read the table by column four rather than column five and the disagreement stops existing. Inside each design the numbers are consistent. Across designs they were never talking to each other.
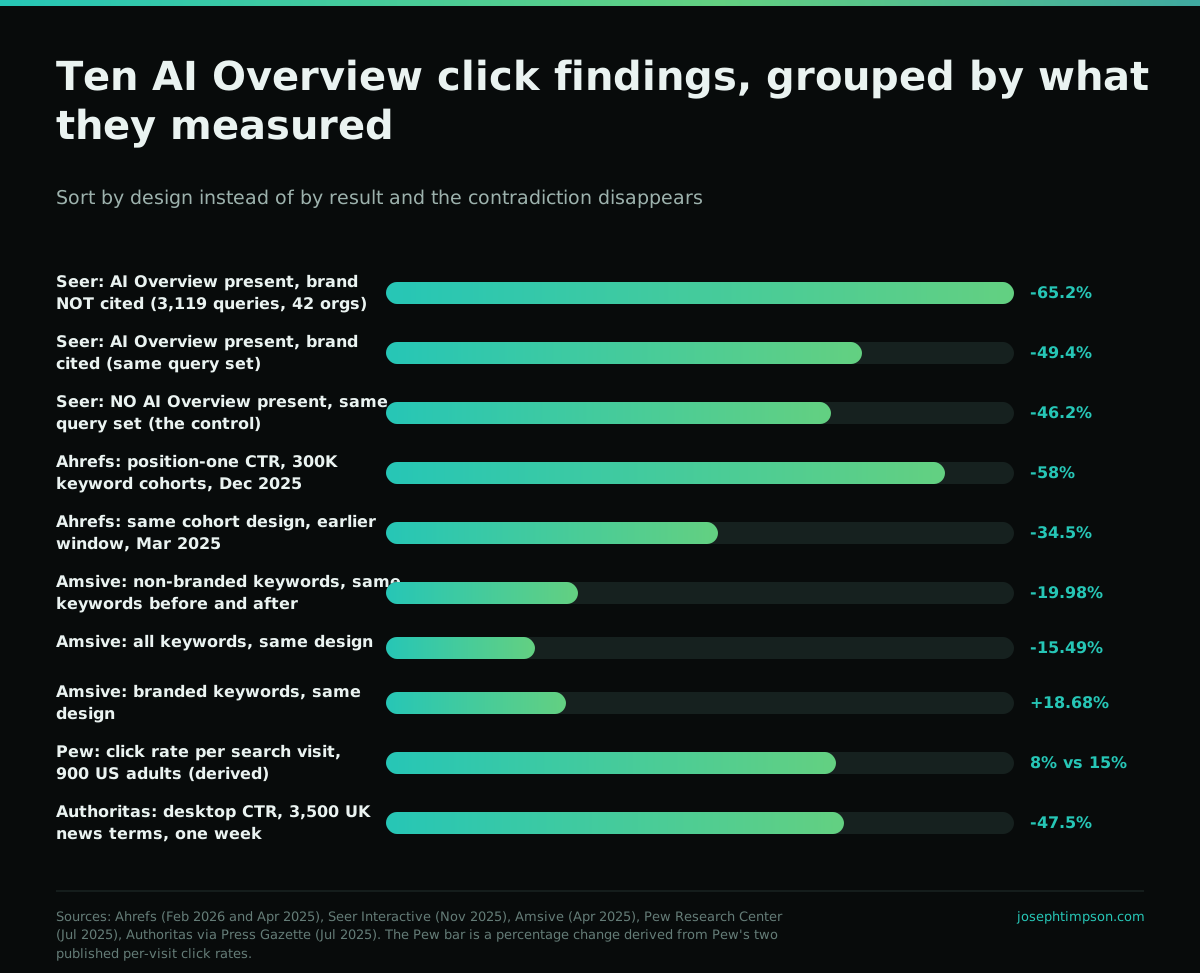
The four variables that produce the entire spread
Every number above is a function of four choices. Change any one and the headline moves by tens of points.
The measured quantity. Position-one CTR, portfolio CTR, per-visit click rate and zero-click share are four different metrics. Pew's 8% is not a CTR at all. It is the proportion of browsing sessions in which the user clicked anything. A page can hold its CTR perfectly while that number collapses, because the two have different denominators.
The query population. Ahrefs restricted to informational keywords for a stated reason: 99.2% of keywords that trigger AI Overviews are informational in intent. Authoritas restricted to UK news terms, which is the single most AI-summarised query class on the internet. Amsive restricted to keywords the client already ranked for. Three restrictions, three different worlds. This is the same sampling problem I write about in how a local AI visibility study should be built, and it is not solved by adding more keywords.
The comparison design. Ahrefs compared two cohorts of different keywords. Amsive and Semrush compared the same keywords to themselves before and after. Cohort designs will always report larger effects, because the with-AI-Overview cohort was selected by Google on the basis of query characteristics that already predicted low click rates. Same-keyword designs are cleaner and consistently produce smaller numbers. That single distinction explains most of the gap between the 58% and the 15.49%.
The window and the baseline. Ahrefs ran the identical method twice and got 34.5% and then 58%. Nothing about the method improved. The window moved. Any number in this field is a snapshot of a system that Semrush measured swinging from a 6.49% AI Overview trigger rate in January 2025 to 24.61% in July and back to 15.69% by November.
The control group nobody quotes
Seer's study contains the most important number in this entire literature and almost nobody cites it.
On the same 3,119 query set, across the same 42 organizations, over the same period, queries where no AI Overview appeared at all saw organic CTR fall 46.2% year over year.
Sit with that. The control group lost nearly half its clickthrough rate with no AI Overview involved. Against a 46.2% baseline decline, the 65.2% figure for uncited pages represents an incremental AI Overview effect of roughly 19 points, not 65.
This is the number that should end most client conversations, and it is the number that gets cut from every roundup because it makes the headline smaller. Search result pages have been getting denser, more commercial and more feature-heavy for a decade. AI Overviews are an accelerant on a fire that was already burning. If you have ever told a client that AI Overviews took their traffic, you owe them this control group.
The mechanism nobody names: the denominator moved
CTR is a ratio. Practitioners argue about it as though only the numerator can change. In 2026 the denominator is what changed.
Here's what we know for certain: clicks were essentially flat in October, moving from 398K to 400K. Impressions more than doubled, from 15.8M to 33.1M. CTR compressed because the denominator grew far faster than the numerator.
That is one month of one dataset, and it reframes the whole argument. Clicks were flat. Impressions doubled. CTR halved. A practitioner reporting "CTR down 50%" that month would have been factually right and strategically wrong, because zero clicks were lost.
Seer Interactive's 2026 update, whose lead author is McDonald, states its own limit plainly: "We cannot claim causation. Higher-authority brands are also more likely to be cited." That sentence is more useful than most of the headlines built on top of the study.
The practical consequence is that CTR is now a broken primary KPI. If impressions and clicks can move in opposite directions at that scale, you have to report both, separately, or your client reporting will tell a story the revenue does not support. Seer's own paid media team found the same shape on the ad side: nonbrand impressions up 28% while CTR fell from 16.39% to 14.13%.
The two findings that went the other way
Two results in the table point in the opposite direction from the consensus. Neither is a fluke and both are load-bearing.
Semrush found zero-click going down. Taking keywords that had no AI Overview in May 2025 and did have one by October, zero-click fell from 33.75% to 31.53%. This is the cleanest natural experiment anyone has published, and the authors offer the explanation themselves: maybe these searches were already unlikely to end in a click. That is the selection effect stated out loud. Google adds AI Overviews to queries that were already answer-shaped. The queries were low-click before the summary arrived.
Amsive found branded keywords gaining.
Interestingly, branded keywords that triggered AI Overviews saw a CTR increase of +18.68% on average.
Only 4.79% of branded keywords triggered an AI Overview in that dataset, so the sample is thin. But the direction is consistent with everything else we know. A user searching your brand name has already decided. A summary of your brand confirms the decision and the click follows. That is why brand mentions matter more than backlinks for AI visibility, and why a portfolio that is 60% branded will see a completely different AI Overview story than one that is 90% non-branded.
Before you quote any figure in this field to a client, check the brand and non-brand split of the study and the brand and non-brand split of the client. If they differ, the number does not transfer.
Google's counter-claim belongs in the table, not above it
Google disputes all of this. That position deserves a row, and it deserves to be judged by the same standard as every other row.
Overall, total organic click volume from Google Search to websites has been relatively stable year-over-year.
In the same post Reid writes that "This data is in contrast to third-party reports that inaccurately suggest dramatic declines in aggregate traffic". She may well be right. Google is the only party with the clean dataset, and every study in the table above is an outside reconstruction of something Google can simply read.
But Google published no sample size, no date range, no methodology and no data. On the columns that let you evaluate a study, Google's row is the emptiest one in the table. When Authoritas published its UK news figures, a Google spokesperson told The Guardian the study was based on flawed assumptions, and again showed nothing.
The asymmetry is the argument. Nine independent measurements with published methods point one way. One unsourced corporate assertion points the other. That is not a tie, and it is not a reason to dismiss Google either. It is a reason to hold every number loosely, including the ones you like.
I built the Cited Method because this literature is unusable as a client deliverable. It starts with crawler access and ends with measurement you can actually defend in a room.
See how I measure AI visibility→Google's own instrument still cannot answer the question
Here is the detail that should end the argument about whose data is better.
As of February 2026, Ahrefs noted that "there is still no way to disambiguate AI Overview clicks and impressions from the rest of your Search Console data."
It seems that Google doesn't want us to see the clickthrough rate for AI Overviews.
Google then shipped a generative AI performance report in Search Console in June 2026. Read the official documentation and the report covers impressions only. Google's own help page defines the metric as how many times links to your site were shown in a generative AI feature, and it is rolling out to a subset of website owners. No clicks. No CTR. No queries.
So the single organization capable of settling this has built a reporting surface that reports the numerator's denominator and nothing else. Until that changes, everything in this field is inference, which is exactly why AI search attribution has to be built from your own logs and your own lead data rather than bought from a dashboard. It is also why the tracking tools all disagree with each other.
What you can defensibly tell a client
Strip out everything that does not survive the table and you are left with a short list. This is what I actually say.
- Every published measurement of non-branded informational queries found clicks falling. The direction is unanimous even where the magnitude is not.
- Most of that decline is not caused by AI Overviews. Seer's no-AI-Overview control group fell 46.2% on the same query set.
- Being cited in an AI Overview is better than not being cited, and worse than the AI Overview not existing.
- Branded queries behave differently and may gain. Check the client's brand and non-brand split before quoting any figure.
- CTR alone is now uninterpretable. Report impressions and clicks separately or you will misread a growing denominator as lost traffic.
- Nobody can measure AI Overview clicks directly, including Google's own Search Console report.
What you should not say: any single percentage, without naming the study, the query population and the design. "AI Overviews cut clicks 58%" is a sentence about 150,000 informational keywords measured against a non-matched cohort on desktop between two Decembers. Said without those qualifiers it is not a finding, it is a vibe.
Rand Fishkin's framing is the one I keep coming back to, because it puts AI Overviews in proportion rather than at the center:
Ten years ago, ~45% of Google searches were zero-click. Today it's 68%.
Twenty-three points of that shift accumulated over a decade, most of it before AI Overviews shipped. Fishkin also notes his own data limitation, that "it's likely the percentage of zero-click searches is even higher than what we've found here," which is more methodological candour than Google has offered on this subject in two years.
What nobody has measured yet
Four gaps, stated plainly, because the honest version of this post has to include what is missing.
Nobody has run a matched same-keyword cohort at scale. Amsive and Semrush did same-keyword designs on modest samples. Ahrefs did a large sample with an unmatched design. The study that does both does not exist, and it is the only one that would settle the causal question.
Nobody has published revenue. Every measurement in this field counts clicks, impressions or citations. Not one counts closed business. If you want an outcome claim, it has to come from your own client data, which is the reason an AI visibility audit starts with the lead ledger rather than a rank tracker.
Nobody has isolated AI Mode. Every study above measures AI Overviews inside classic Search. AI Mode is a different surface with different retrieval behavior and its own referral profile, and no independent CTR study of it exists.
Nobody has confirmed the recovery. Seer's rebound from a 1.3% floor in December 2025 to 2.4% in February 2026, reported by Search Engine Land as an early sign of recovery, is the most encouraging data point in the field and it is two months long, from one portfolio, published by the same firm that produced the most alarming figure. It needs replication before anyone builds a strategy on it. Treat it the way you should treat any small-sample AI visibility signal.
The field will keep producing these studies, and each one will get a headline that strips the method. Keep the table. When the next number lands, put it in a row, fill in columns three and four, and see whether it is telling you something new or telling you the same thing from a different angle.
Most of the time it will be the second one. That is the actual finding, and it is why I spend far more of a client's budget on crawler access than on chasing a metric Google will not let anyone see. More published reconciliations live in the insights archive, and if you want the version applied to a real site, that is what a working session covers.
Frequently asked questions
Do AI Overviews reduce click through rate?
Yes, on non-branded informational queries. Every published study found clicks falling, from 15.49% (Amsive) to 65.2% (Seer). But Seer's control group with no AI Overview present fell 46.2% on the same query set, so most of the decline is not attributable to AI Overviews.
Which AI Overviews CTR study should I cite?
Cite the one whose design matches your question. Ahrefs for position-one CTR on informational keywords. Amsive for keywords a site already ranks for. Pew for real user behavior. Seer for an agency portfolio. Naming the study alone is not enough, name the query population too.
Why did Amsive find that branded keywords gained CTR?
Because branded searchers have already decided. An AI Overview summarising your brand confirms the choice rather than replacing the visit. Amsive measured +18.68% on branded keywords, though only 4.79% of branded keywords triggered an AI Overview in that dataset, so the sample is thin.
Has Google published its own AI Overview click data?
No. Liz Reid stated in August 2025 that total organic click volume has been relatively stable year over year and called third-party studies methodologically flawed. Google released no sample size, date range, methodology or dataset alongside that claim, then or since.
Does Search Console show AI Overview clicks?
Not yet. Google's generative AI performance report launched in June 2026 and shows impressions only, defined as how many times links to your site appeared in a generative AI feature. It carries no clicks, no CTR and no query data, and is rolling out to a subset of sites.
Why did Semrush find zero-click going down?
Semrush compared the same keywords before and after they gained an AI Overview and found zero-click falling from 33.75% to 31.53%. The likely reason, which the authors raise themselves, is selection: Google adds summaries to queries that were already unlikely to earn a click.
Is AI Overview CTR recovering in 2026?
Possibly. Seer recorded organic CTR on AI Overview queries rising from a 1.3% floor in December 2025 to 2.4% in February 2026. That is two months from one 53-brand portfolio, published by the same firm that produced the largest decline figure. Wait for replication.
What should I report to clients instead of CTR?
Report impressions and clicks as separate lines. Seer documented a month where clicks moved from 398K to 400K while impressions went from 15.8M to 33.1M. CTR halved and no traffic was lost. A single ratio cannot distinguish lost clicks from added impressions.
Sources
- Ahrefs. Update: AI Overviews Reduce Clicks by 58% (2026-02)
- Ahrefs. AI Overviews Reduce Clicks by 34.5% (2025-04)
- Seer Interactive. AIO Impact on Google CTR: September 2025 Update (2025-11)
- Seer Interactive. AIO Impact on Google CTR: 2026 Update (2026-04)
- Amsive. Google AI Overviews: New CTR Study Reveals How to Navigate Negative SERP Impact (2025-04)
- Pew Research Center. Google users are less likely to click on links when an AI summary appears in the results (2025-07)
- Semrush. Semrush AI Overviews Study 2025 (2025-12)
- SparkToro. In 2026, Less Than One Third of Google Searches Still Send a Click (2026-06)
- Press Gazette, reporting Authoritas. Publishers lose 50% of clickthrough rate due to AI Overviews (2025-07)
- Google. AI in Search: driving more queries and higher quality clicks (2025-08)
- Google Search Console Help. Generative AI performance report (Search) (2026-06)
- Google Search Central. Introducing Search Generative AI performance reports in Search Console (2026-06)
- Search Engine Land. Google AI Overviews CTR shows early signs of recovery: Study (2026-04)
- Search Engine Land. Google AI Overviews drive 61% drop in organic CTR, 68% in paid (2025-11)
- IDEAVA. Google AI Overviews Are Crushing CTRs: What 12 Studies Reveal (2026)
- Seer Interactive. Zero-click search and paid strategy (2026-07)
Joseph Timpson has worked in search since 2010 and runs Timpson Marketing out of St. George, Utah. He built The Cited Method, a five stage framework for earning and proving real citations in AI answers, and publishes what does not work alongside what does.
Want me to run this on your site and show you the before and after?
One call, no pitch deck. We look at what is actually blocking you and tell you the truth about whether we can help.
Book a free consultation →